Candlestick Patterns Every Crypto Trader Should Know
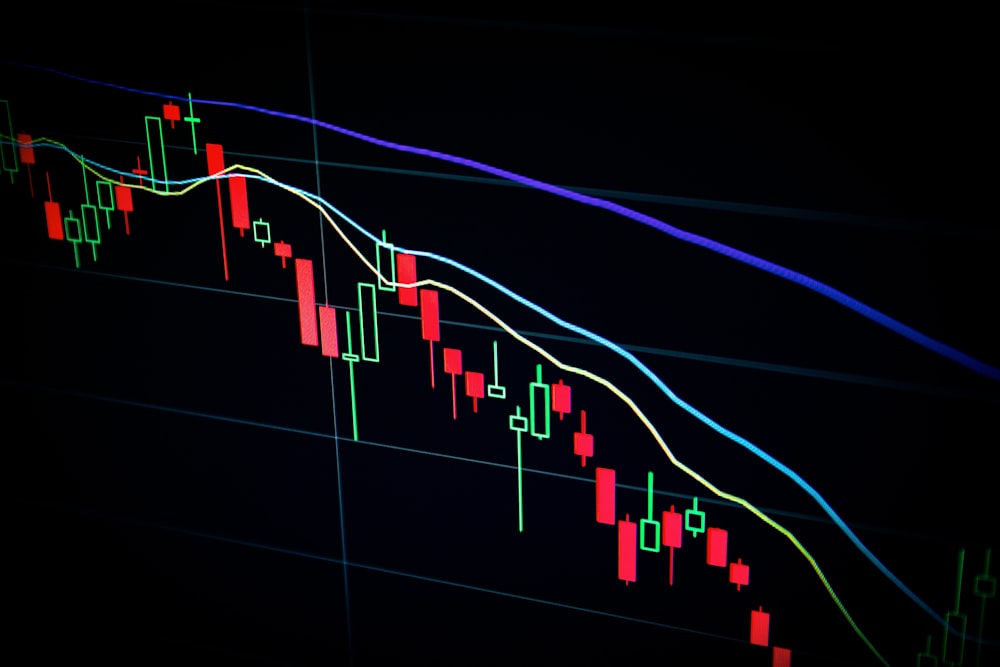
Candlestick charts are the default view for most crypto traders, and certain candle shapes — "patterns" — are watched closely because they can hint at shifts in momentum. Understanding them helps you read market psychology, as long as you remember they are signals of probability, not certainty.
A doji forms when the open and close are almost equal, leaving a small or nonexistent body with wicks on both sides. It reflects indecision — buyers and sellers in balance. After a strong move, a doji can hint that momentum is fading.
The hammer is a candle with a small body and a long lower wick, appearing after a decline. It suggests sellers pushed price down but buyers stepped in and recovered much of the move — a possible sign of exhaustion among sellers. Its mirror image after a rally, the shooting star, hints at the opposite.
Engulfing patterns involve two candles: a bullish engulfing candle fully "engulfs" the previous red candle's body, suggesting buyers have taken control. A bearish engulfing does the reverse. These are among the more reliable two-candle signals when they appear at key levels.
Context is everything. A hammer in the middle of a choppy range means little; the same hammer at a major support level after a long decline carries far more weight. Patterns gain meaning from where they appear, not just their shape.
The key caution: candlestick patterns are not guarantees. They reflect short-term sentiment and frequently fail, especially in volatile crypto markets. Experienced traders use them as one input among many — combined with trend, volume and risk management — rather than as standalone buy or sell triggers. This article is educational and not financial advice.