Technical Analysis 101: How to Read Crypto Charts
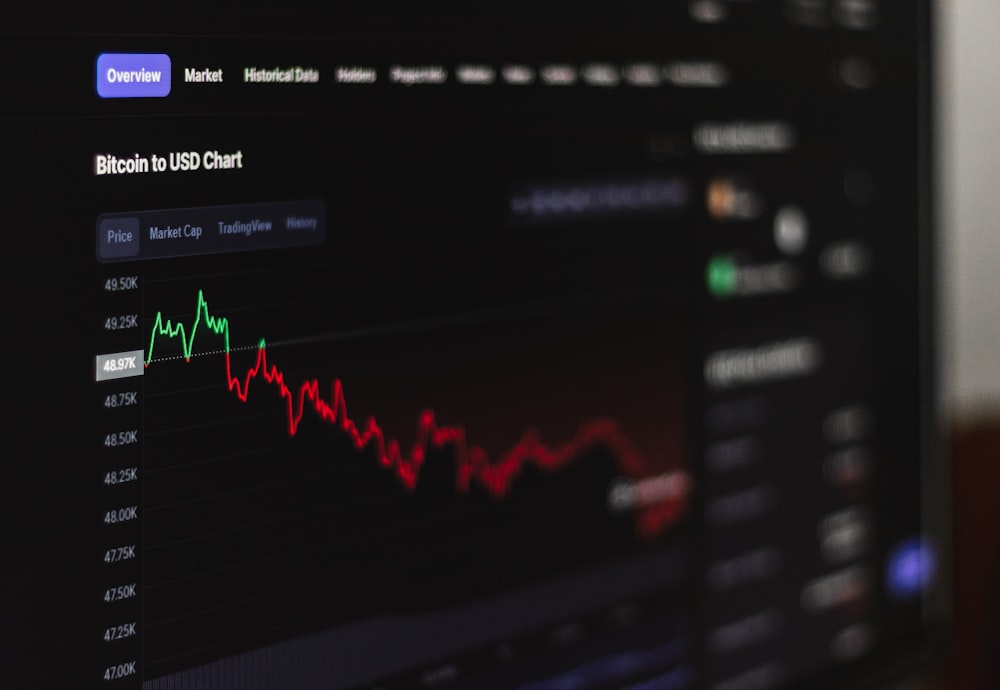
Technical analysis (TA) is the study of price charts to understand market behavior. It does not predict the future, but it gives traders a structured way to read what the market is doing right now. For anyone watching crypto markets, learning to read a chart is a foundational skill.
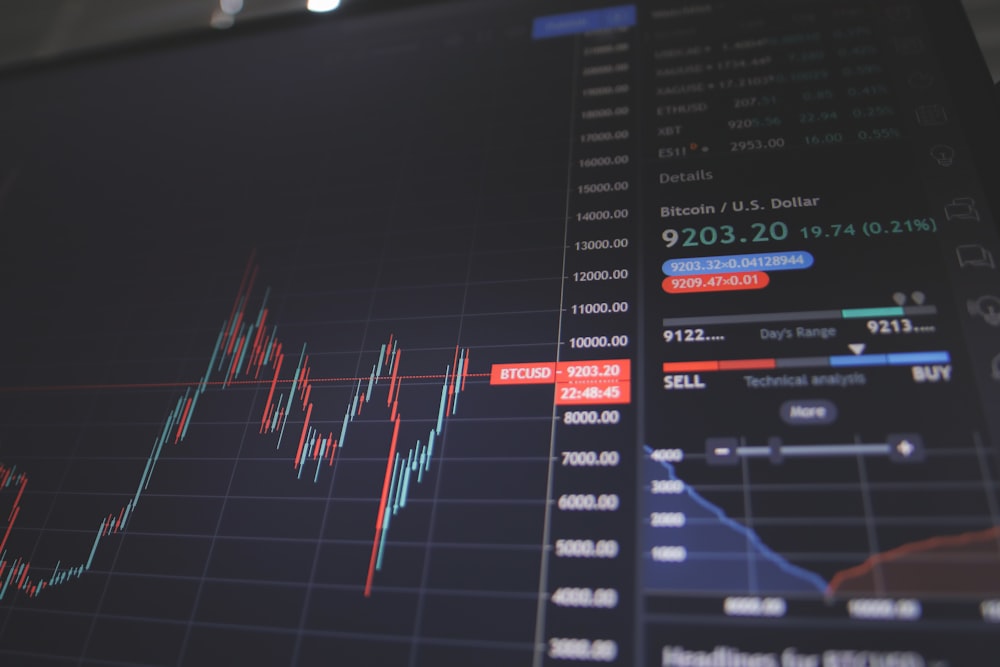
The most common chart is the candlestick chart. Each candle represents price action over a period of time — one minute, one hour, one day, and so on. The body shows the open and close; the thin wicks show the high and low. Green (or white) candles mean price closed higher than it opened; red (or black) candles mean it closed lower.
Timeframes matter enormously. A chart can look bullish on the 15-minute view and bearish on the daily view at the same time. Shorter timeframes show noise and quick moves; longer timeframes show the bigger structure. Many traders check several timeframes before forming a view.
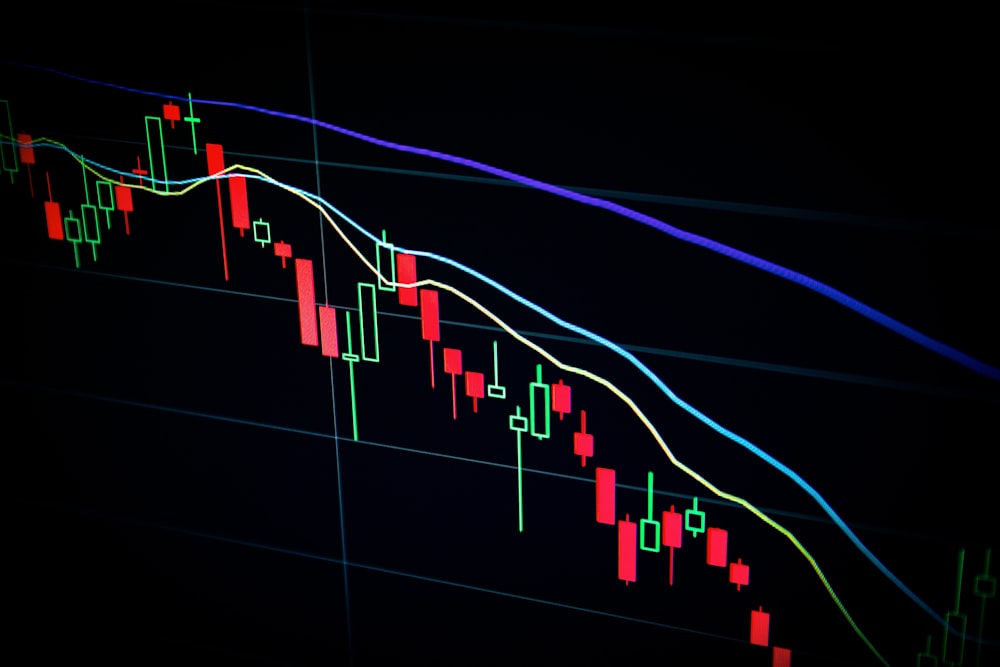
The single most important concept is trend. Markets generally move in trends — a series of higher highs and higher lows in an uptrend, or lower highs and lower lows in a downtrend — interrupted by sideways "ranges." Identifying whether a market is trending or ranging shapes everything else.
Volume adds context. A price move on high volume carries more conviction than the same move on thin volume, which can reverse easily. This is especially true in crypto, where smaller assets can be moved by relatively little trading activity.
It is worth being honest about the limits of TA. Patterns are probabilities, not certainties, and no chart guarantees what happens next. Markets are driven by news, liquidity and human emotion as much as by lines on a screen. Used well, technical analysis is a tool for managing risk and reading context — not a crystal ball. This article is educational and not financial advice.