Moving Averages and RSI: Two Indicators Traders Watch

Indicators are calculations layered on a price chart to highlight aspects of market behavior. Two of the most widely used in crypto are moving averages and the Relative Strength Index (RSI). Knowing how they work — and their limits — is useful for reading market conditions.
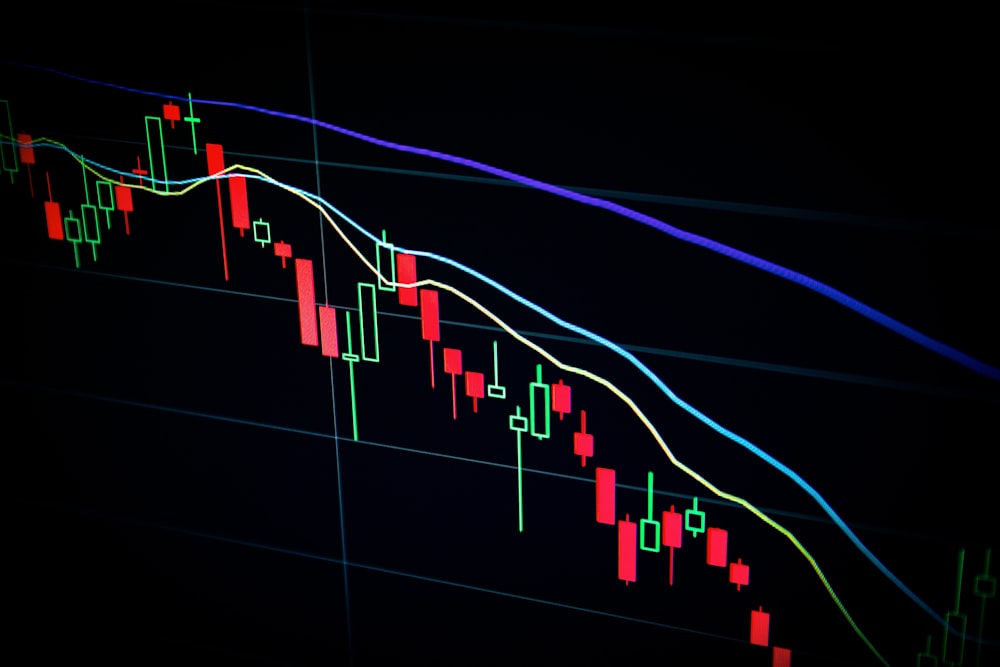
A moving average (MA) smooths price over a chosen period to reveal the underlying trend. A 50-day MA, for example, averages the last 50 daily closes. When price is above a rising MA, the trend is generally considered up; below a falling MA, down. Traders also watch crossovers, such as a shorter MA crossing above a longer one, as a momentum signal. The trade-off is that MAs lag — they confirm trends rather than predict them.
The RSI measures the speed and magnitude of recent price moves on a scale of 0 to 100. Readings above 70 are traditionally called "overbought" and below 30 "oversold." The idea is that extreme momentum may be unsustainable. However, a common beginner mistake is treating overbought as an automatic sell signal — in strong trends, RSI can stay overbought for a long time while price keeps rising.
Both indicators work best as context, not commands. A moving average tells you about trend direction; RSI tells you about momentum and potential exhaustion. Many traders combine them with price structure and volume rather than acting on any single reading.
The broader lesson is that no indicator is magic. They are mathematical summaries of past price, and they fail regularly, especially in volatile crypto markets. Their value is in adding perspective and discipline, not in producing guaranteed signals. Used carelessly, indicators create false confidence; used thoughtfully, they support better risk decisions. This article is educational and not financial advice.